Start improving with Life QI today
Full access to all Life QI features and a support team excited to help you. Quality improvement has never been easier.

Organisation already using Life QI?
Sign-up

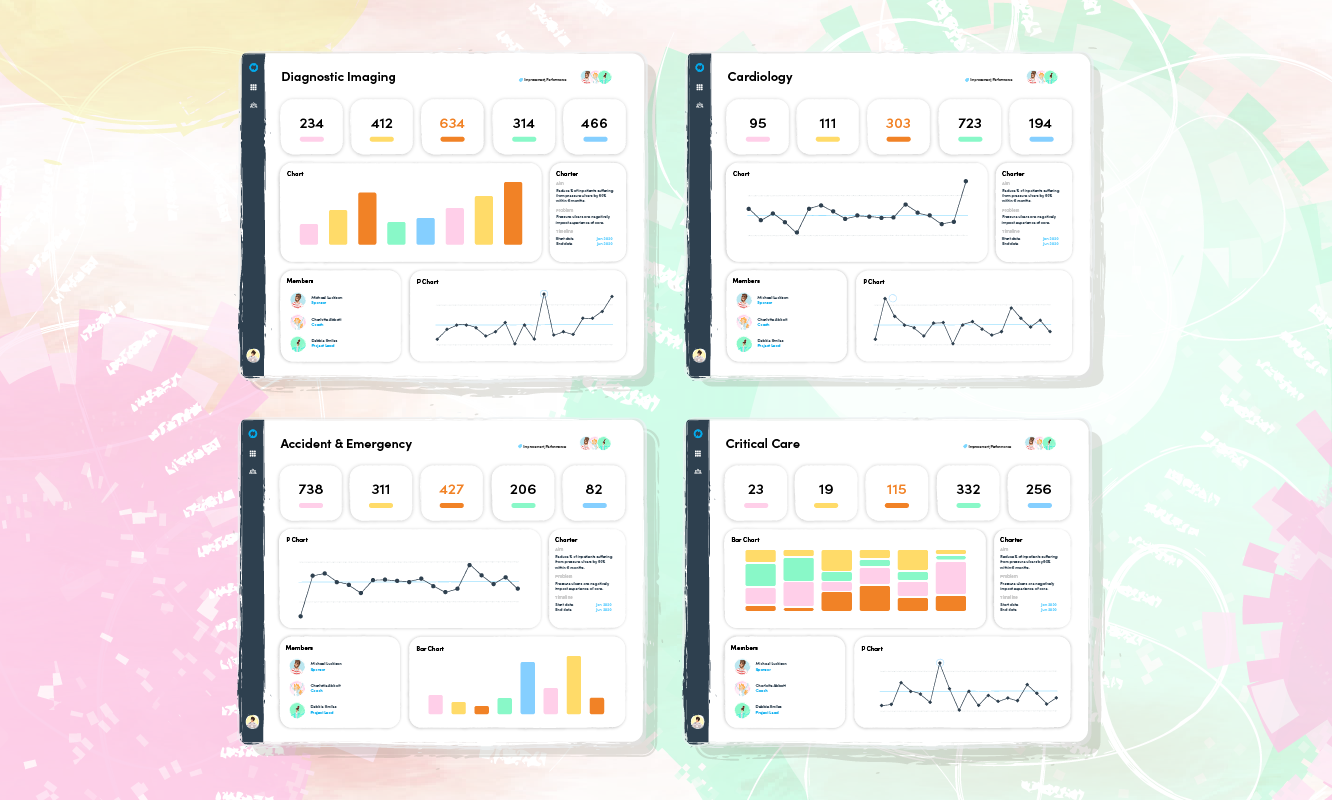
Groups are used to represent the key elements of your organisational structure, e.g., your Divisions, Departments, and/or Service Lines. These groups you have in place will generally mirror where the improvement work is taking place, and how the governance and reporting mechanisms work.
This hierarchy will support the ownership of work taking place across each group. QI leads for their specific area, such as a Surgical Division, can accurately track the QI work happening and gain an insight to areas that are demonstrating successes and those that require further support.
Each group is created and linked to the organisation appropriately, see this link here on how to create a group.
Each group has their own dashboard that is built from the same template, to allow for consistency of reporting across the organisation, and a unique dataset (for the group).
These are a highly valuable resource for taking to meetings and using interactively to go over work to date and highlight any areas of success or concern. They are extremely useful for prioritising the time of Coaches, Improvement Advisors and Sponsors, who may be involved in many projects. The dashboard will easily highlight the projects that need your attention versus those that are progressing well; allowing you to simply focus your time on those most in need of your support.
Watch a quick run through of a group dashboard here:
Full access to all Life QI features and a support team excited to help you. Quality improvement has never been easier.

Organisation already using Life QI?
Sign-up