Start improving with Life QI today
Full access to all Life QI features and a support team excited to help you. Quality improvement has never been easier.

Organisation already using Life QI?
Sign-up

This is by far one of the most important dashboards that you can use across your organisation. Every organisation in Life QI has a default dashboard that you can view in the ‘Analytics’ module located in the navigation panel – go and check yours out!
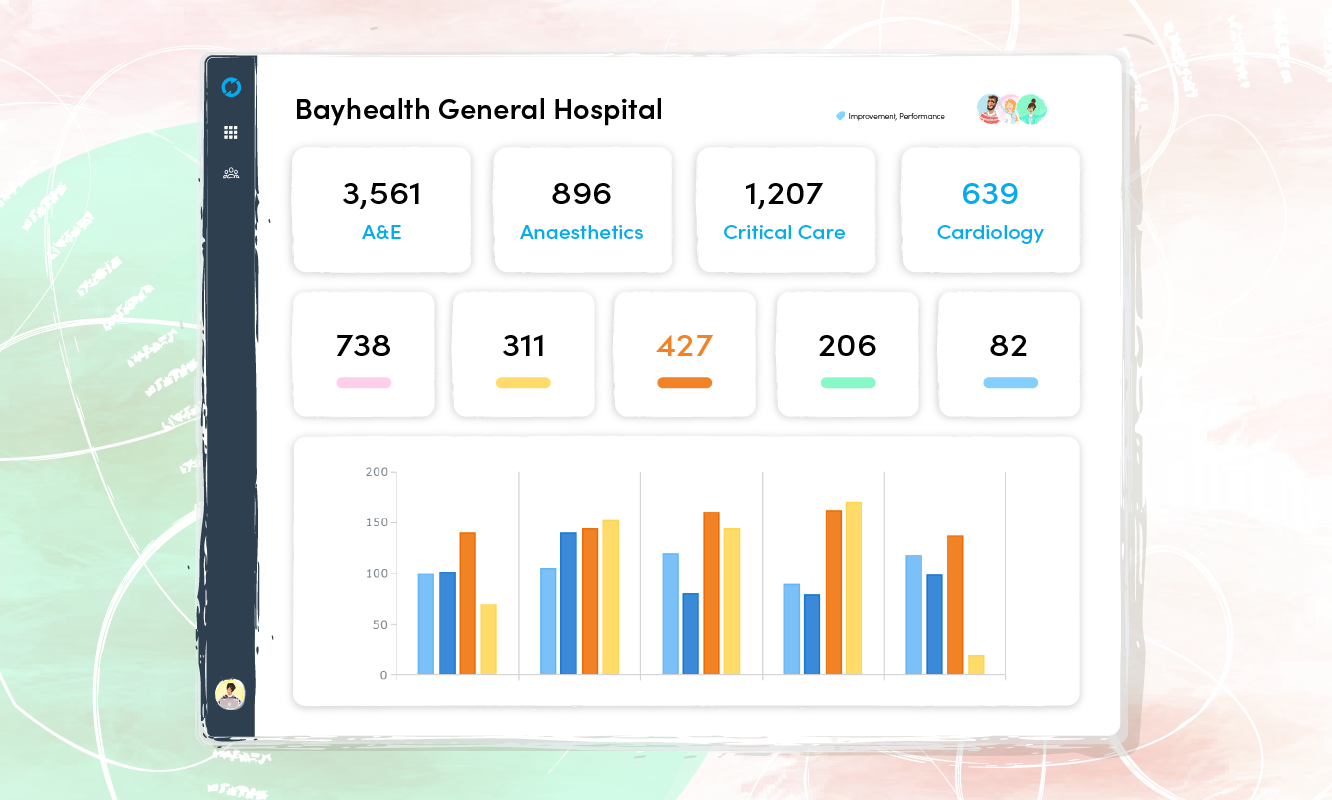
An example of an Organisational view dashboard is here:
The dashboard provides the top level, overarching view of every project linked to your organisation – covering active, completed and cancelled projects. It includes top level counts (e.g. number of active projects) and charts to show growth and impact of improvement work overtime.
Really importantly - this dashboard can be tailored further and pull through specific key metrics that your organisation is working towards, such as key priorities, key themes and alignment of work to Department groups.
The use of these real-time views is extremely powerful to focus attention and raise awareness of the level and impact of QI work taking place. Use these live-in meetings to have full visibility of the work taking place and facilitate discussions to share learning and inform actions.
The organisation-wide dashboard is available for all staff to review but is commonly used by the Exec or Board to review the impact of the improvement work taking place across the organisation. If there are specific metrics your Board wish to track you can customise your dashboard to suit – if you’re not sure how speak to your Success Manager or contact the Help team.
It is not always appropriate to look across the entire organisation’s improvement portfolio, sometimes you want to focus on a department, theme of work, training cohort or use a dashboard to review usage of Life QI.
Full access to all Life QI features and a support team excited to help you. Quality improvement has never been easier.

Organisation already using Life QI?
Sign-up