If you are unsure of how an SPC chart breaks down and have heard certain buzz words mentioned when referring to an SPC chart but didn't want to ask what it meant, then take a look at these basic pointers below.
1. Phases
- Baseline phase is the data collected and used as a basis for comparison to determine what the process is currently doing.
- Test phase is data collected during the testing of changes to the process to establish if the changes are having a statistically positive effect.
- Sustain phase is continuing to collect data and measure it to ensure the improvements in the test stage are sustained.
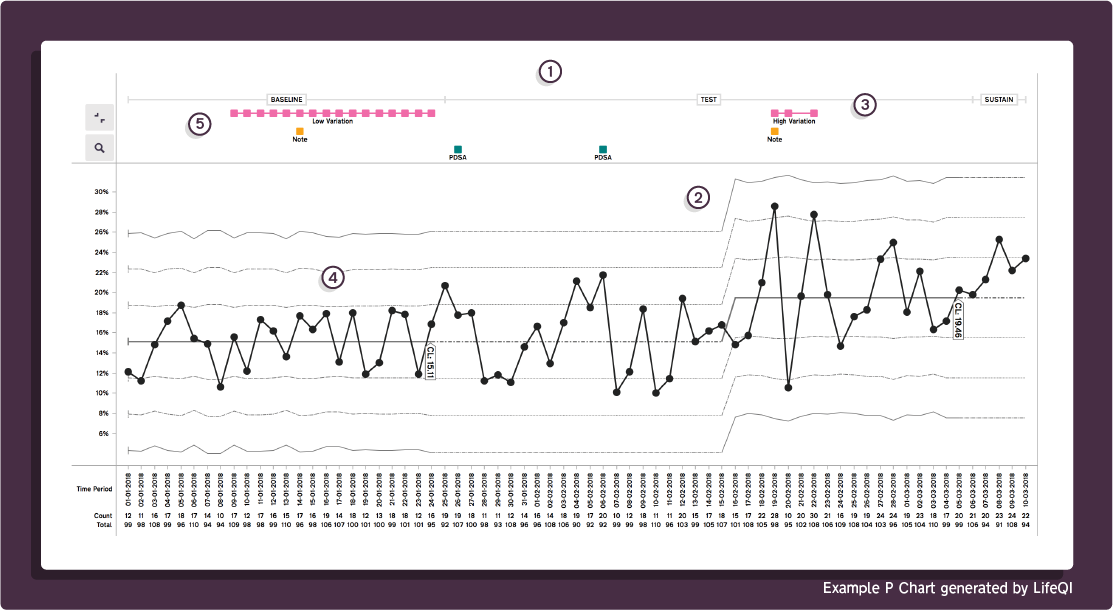
2. Control Limits
- LCL (Lower Control Limits) appears as a horizontal dashed line below the process average. Generally considered to be three times the standard deviation of the process measurements.
- UCL (Upper Control Limits) appears as a horizontal dashed line above the process average. Generally considered to be three time the standard deviation of the process measurements.
- CL (Central Line) A Horizontal graphical line designating the mean or median of process measurements.
3. Special Cause Variation
- A Trend is six consecutive points decreasing or increasing
- High variation is two out of three points in the outer 1 third of the chart, between the +2 and +3 sigma or between the -2 and -3 sigma limits.
- An Outlier is a single data point that lies above the UCL or below the LCL. This can indicate a severe disturbance in the process or a data entry problem.
- A Shift is a run of eight or more data points in a row above or below the centre line.
- Low variation is fifteen consecutive points in the inner third of the chart, between the -1 and +1 sigma limits.
4. Data Points
- A discrete unit of information derived from a measurement, usually represented numerically and/or graphically
5. Annotations
- Identifying where PDSA cycles have taken place, and adding notes to data points.
Common Cause & Special Cause Variation:
Common Cause Variation
Variation that is expected and natural in the system. Whilst this does not indicate that the system is working well, it does mean that the system is stable and predictable.
Special Cause Variation
Variation that is unexpected and not a consistent part of the process. These causes are often infrequent but can result in a chaotic problem. The cause could possibly be a defect in the system or a problem that has never happened before.