Start improving with Life QI today
Full access to all Life QI features and a support team excited to help you. Quality improvement has never been easier.

Organisation already using Life QI?
Sign-up

As virtual training is quickly overtaking face to face training, organisations are looking for ways to easily track and monitor the progression of multiple projects within a training cohort. In a world of virtual learning there is an increasing pressure to be able to house all project metrics and updates in one central repository reducing the need for paper records.
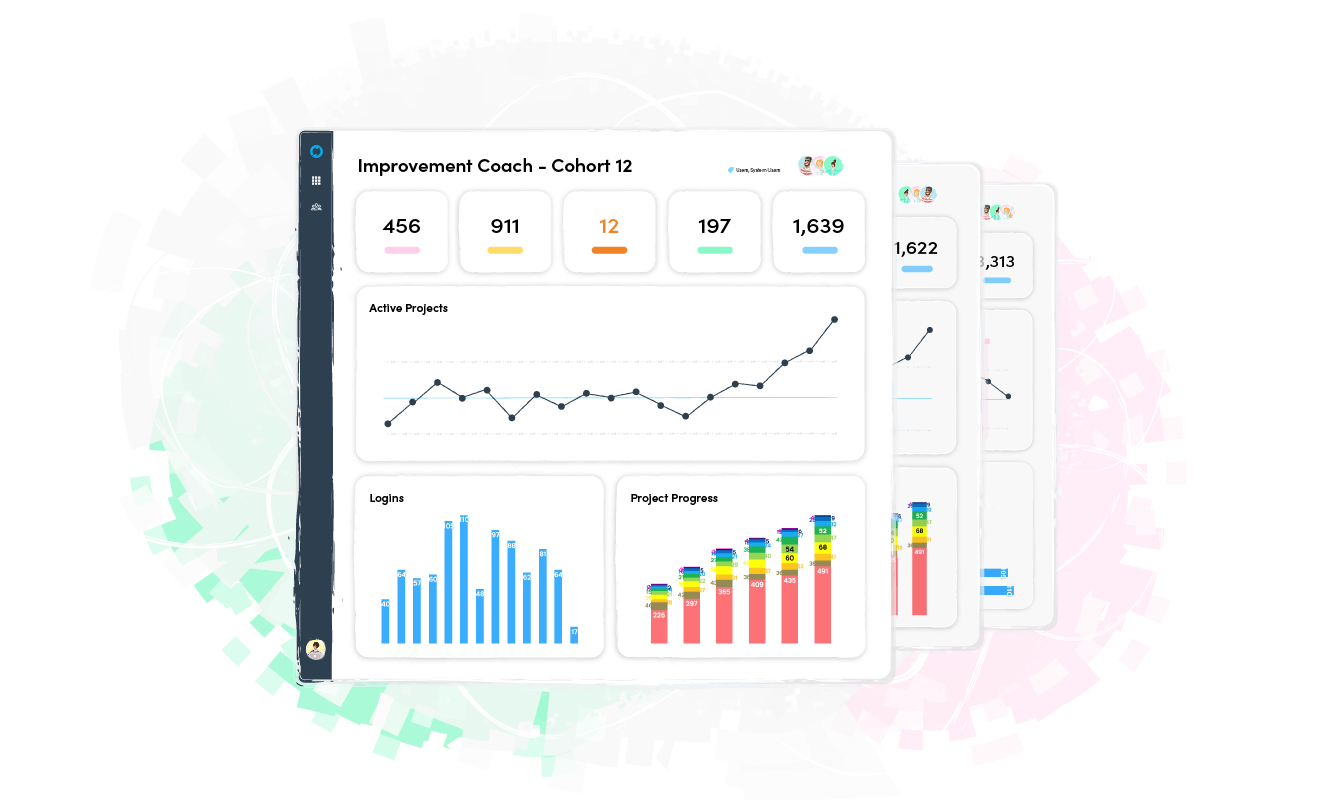
Life QI analytics gives you real-time information on the activity and progress within
each project enabling you to track metrics across multiple projects that are important to your organisation and specific training programme. Your dashboard can provide both high level metrics as well as more granular detail on each project, whether this be the number of active projects, the number of projects showing an improvement, how many stalled projects there are, which projects align to your organisation’s priorities, cumulative projects over time or a project table summary showing the amount of SPC charts, PDSA cycles and the last updated status text and date.
Not only are these dashboards a great tool for the coaches to monitor progress of projects they can also be shared with the participants to aid with peer-to-peer learning as well as evidencing the success of the training programme to senior managers.
With all this information at your fingertips the traditional reporting cycles, where each participant has to write up the progress and what has / hasn’t been achieved, can be a thing of the past!
Want to find out more about bespoke analytics dashboards contact your Success Manager or check out our help articles.
Full access to all Life QI features and a support team excited to help you. Quality improvement has never been easier.

Organisation already using Life QI?
Sign-up