Xbar-S Chart

Picture of Kerrie Preston

Published on 9 August 2018 at 14:58

by Kerrie Preston

X bar S chart
Xbar-S Charts are used to chart data that is measured (e.g. time, money, physical health parameters). Use this chart if your data is comprised of multiple sub-groups and you have breakdowns of this data.
 
For example average waiting time for first appointment across multiple teams, when you have the detailed breakdown of averages for those multiple teams. The Xbar-S chart will take into account the number of subgroups you have and the variation between these.
 
Therefore you need to enter calculations for the average and standard deviation for each data point before you can plot the chart. Once you have done this, it will create 2 charts, one shows the average and the other which shows the extent of range in each data point.


 Typical instances in healthcare would be:

  • Average cost per episode of falls across all inpatient wards
  • Average waiting time for 1st appointment across multiple teams


Xbar-S Chart Example

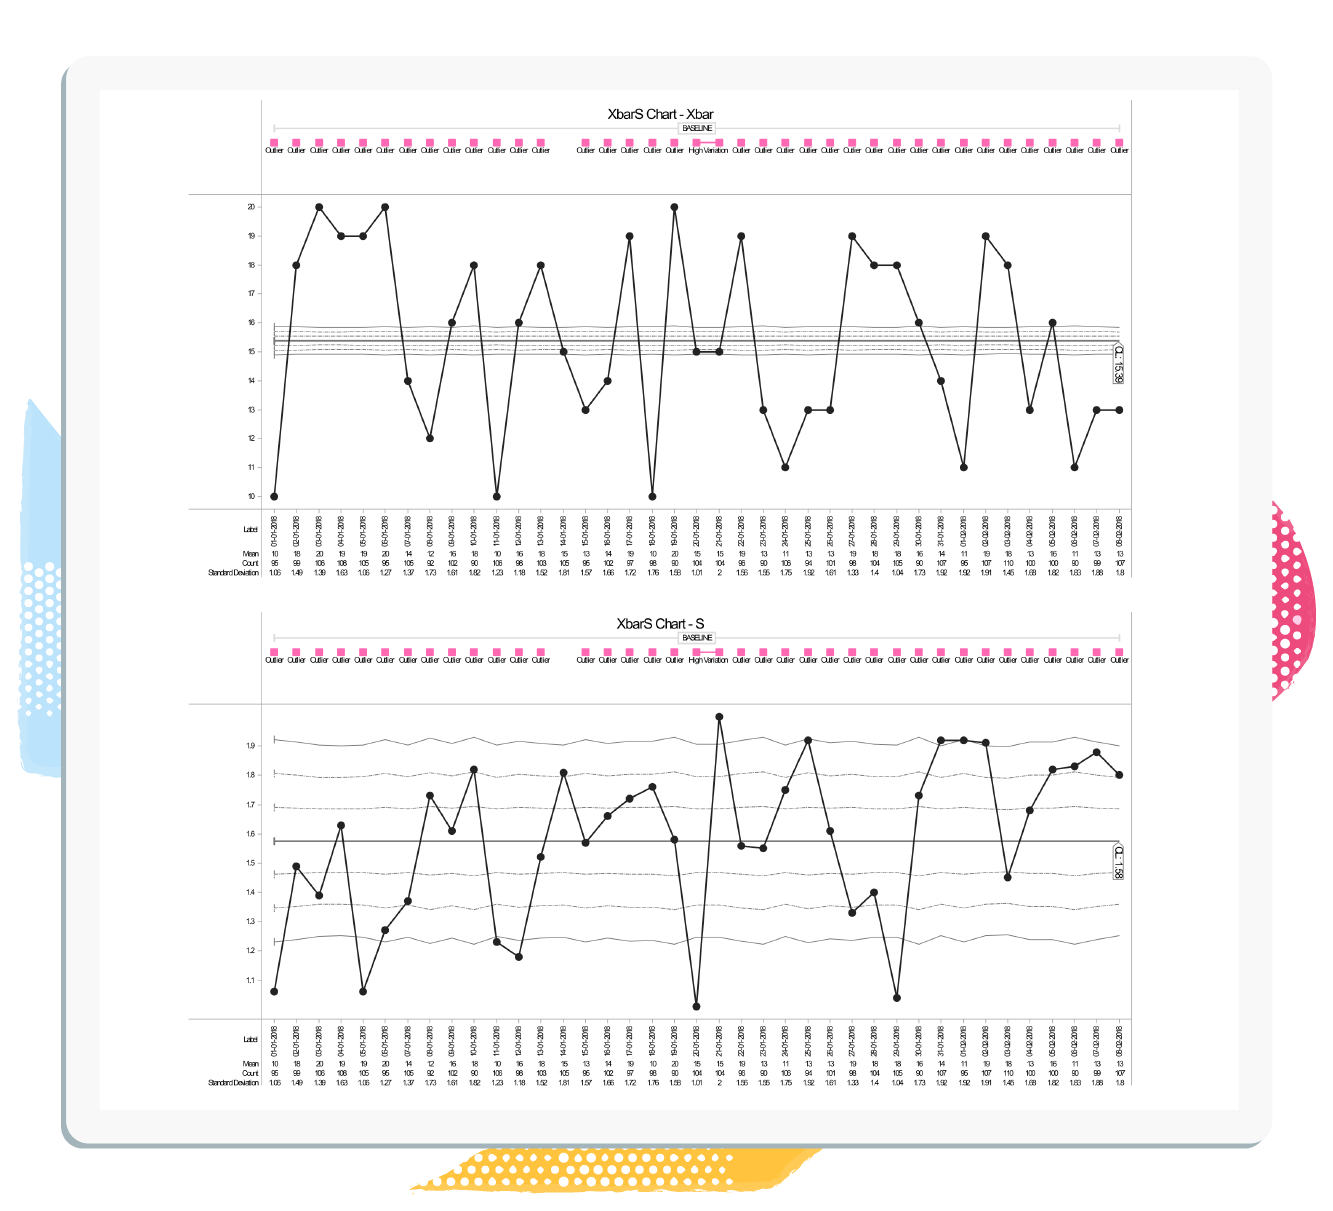
Here we will show you what data is required when creating an Xbar-S Chart and how this is reflected in the Chart itself. 


So lets say the 'Aim' of the project was:

To make a 30% costing saving by reducing the number of falls across all inpatient wards within 12 months.

and the measure was:
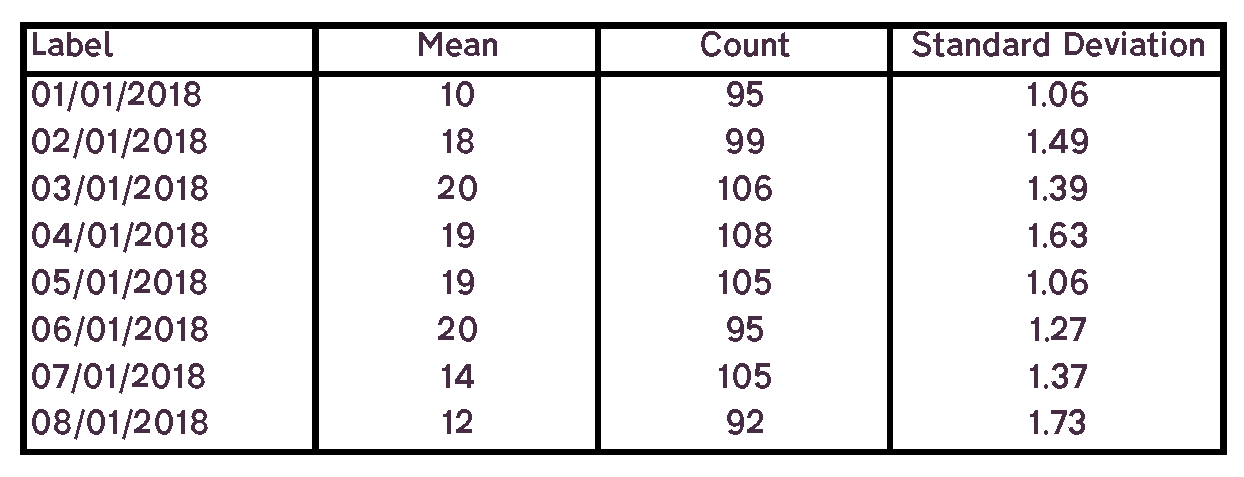
Average cost per episode of falls across all inpatient wards


You would need to capture the following data:

Label / Time Period Dates when the value was recorded (Daily, Weekly).
Mean Mean of all the measurements recorded for each time period.
Sample The number of sub-group measurements collected at each time period.
Standard Deviation Standard deviation of all the measurements recorded for each time period.


Data Capture Example:

Average cost per episode of falls across all inpatient wards


XbarS example data sheet
Xbar-S Control Chart Example:
Average cost per episode of falls across all inpatient wards


XbarS-1


Start improving with Life QI today

Full access to all Life QI features and a support team excited to help you. Quality improvement has never been easier.

Free 30 day trial