Start improving with Life QI today
Full access to all Life QI features and a support team excited to help you. Quality improvement has never been easier.

Organisation already using Life QI?
Sign-up

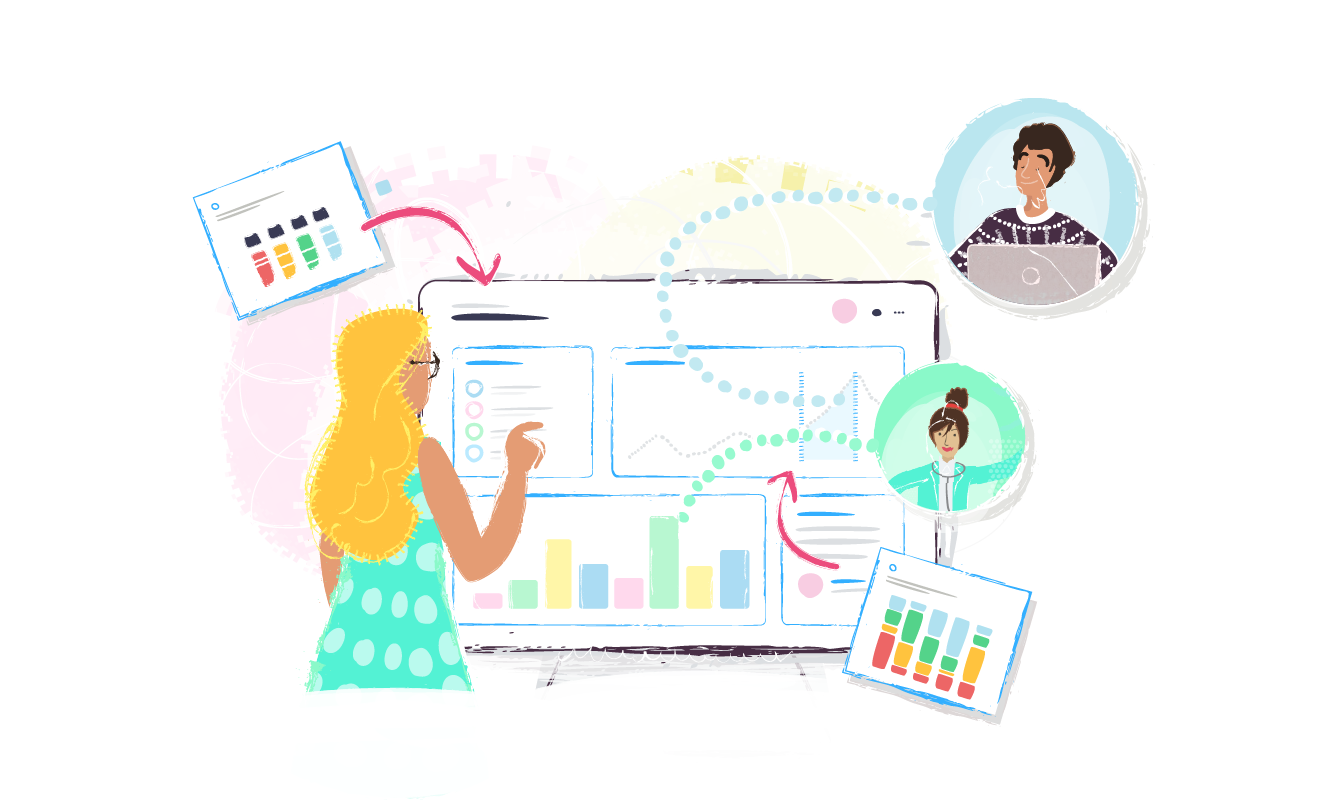
The use of real-time reporting is proving ever more important to monitor key metrics and support organisational objectives. A range of comprehensive analytics dashboards in Life QI can be used to report both at the level required (e.g., hospital, division, or organisation-wide) but also in the form required (e.g., summary project content, aggregate metrics, and over-time metrics).
We work across 100s of organisations that have customised their analytics dashboards in Life QI to provide a powerful and a methodical way to analyse their organisation’s improvement work. This snapshot of metrics drawn from internal QI data allows teams to understand the level and the impact of the work taking place.
The Analytics area is easy to use, interactive and reduces administration burden of teams to keep everything up to date in one central place.
Throughout this article we will be providing you with guidance and further information on how to best utilise dashboards within Life QI to promote visibility and monitoring of improvement work.
From experience, we encourage organisations to have different levels of dashboards to allow monitoring at the required levels and by relevant stakeholders. The most common levels of dashboards tend to be:
You’re also able to create dashboards for specific working groups or themes of work. The combination of the common dashboards (normal linked to the organisational structure) and thematic dashboards allows for a powerful real-time dashboard setup providing all stakeholders easy access to key insights on improvement activity and impact.
The hierarchy of dashboards that you can have will support the ownership of work taking place across each subgroup. QI leads for each area of the organisation can accurately track the QI work taking place and gain an insight to areas that are demonstrating successes and those that require further support.

1. Organisational: A high level overview dashboard of all registered projects taking pace within the organisation to provide an understanding of the quantity and impact of improvement work.
2. Directorates/Divisions/Service Lines: A detail orientated view of QI projects taking place within certain subgroups of the organisation.
3. Administration: Are you a Life QI Administrator? The admin level dashboard is focused much more on user activity (rather that QI activity). These dashboards can track sign ups and logins over time and help track the utilisation of your Life QI licences.
4. Training: A dashboard to track the activity of users and projects that have been part of training cohort.
5. Themes (e.g. Joy in Work, Medication Optimisation, COVID Response): Report on key workstreams or themes that are relevant to your organisation by categorising projects to demonstrate and evidence compliance and innovation.

Many of the central improvement teams we work with are trying to foster ownership of improvement by division/department leaders. But without visibility of the local improvement work its hard for divisional leaders to know what they are taking ownership of. This is where your Life QI dashboards come in!
Often for the first time, central improvement teams can equip all their divisions/departments/services with accurate real-time insights into the work taking place within their part of the organisation. This has been shown to quickly flip the conversation with local leaders from “what QI work are we doing?” to “how are we going to make the most of all these great ideas?”.
So calling all improvement teams – get your local dashboards setup and start leveraging their power with local leaders!
Furthermore, given that the dashboards provide real-time insights into the improvement work taking place across the organisation they normally form the basis of your improvement management information and decision making, i.e. your improvement governance and reporting can all be run from Life QI dashboards.
Use your dashboards live in meetings. Reduce the need for supporting spreadsheets, slide decks, documents and most importantly reduce the need to print anything off.
Load up Life QI and your dashboard in your meetings to provide an interactive and interesting way to report on the work that is happening. The nature of the dashboards enables a quick and easy way to navigate to projects of interest and help to focus discussions to key areas.
Even if you’re in a virtual meeting – share your screen, open up the relevant dashboards and guide the conversation based on live data – not out of date data.
Are you currently working across organisations, such as part of an Integrated Care Partnership or a Collaborative that involves other organisations?
Using Life QI to run the QI work will enable you to have the key reporting metrics pulled together in one central place to have a system-wide view of the work taking place. This will allow partners to track, share and collaborate easily on areas of work and provide an effective (and time saving!) way to achieve maximum QI productivity in a well organised way.
For advice on how to setup cross-organisation dashboards please speak to your Success Manager or contact the Help team.

Despite the increasing prevalence of QI teams, programmes and senior quality executives, there remains little guidance and defined mechanisms for tracking the ROI of QI work. This article presents our insights into how this can be done based on the literature and our experiences of working with healthcare organisations around the world.
We have a dedicated Analytics section on the help centre to walk you through the analytics functionality and how to build your own dashboards. Please also reach out to your Success Manager who will help you further and answer any queries.
Full access to all Life QI features and a support team excited to help you. Quality improvement has never been easier.

Organisation already using Life QI?
Sign-up